Homework 6
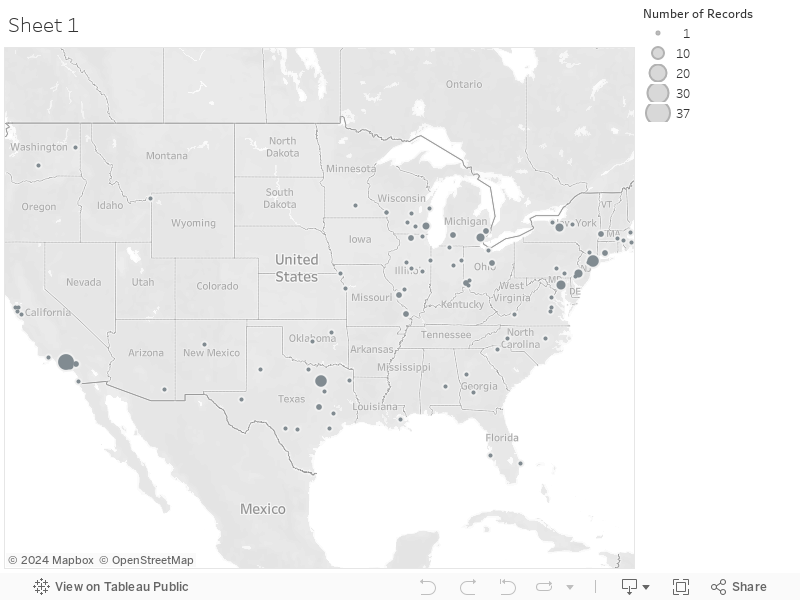
Map 1 simply shows the number of people exonerated in a given state from 1989-2017.
I couldn't get the Tableau's geocoding to work correctly for all of the "city" values, so half of the data ended up not showing in Map 2. I think it was because some of the addresses gave provinces instead of cities, so Tableau couldn't recognize them when I categorized the column as "GEOGRAPHIC ROLE: CITY".
Map 1
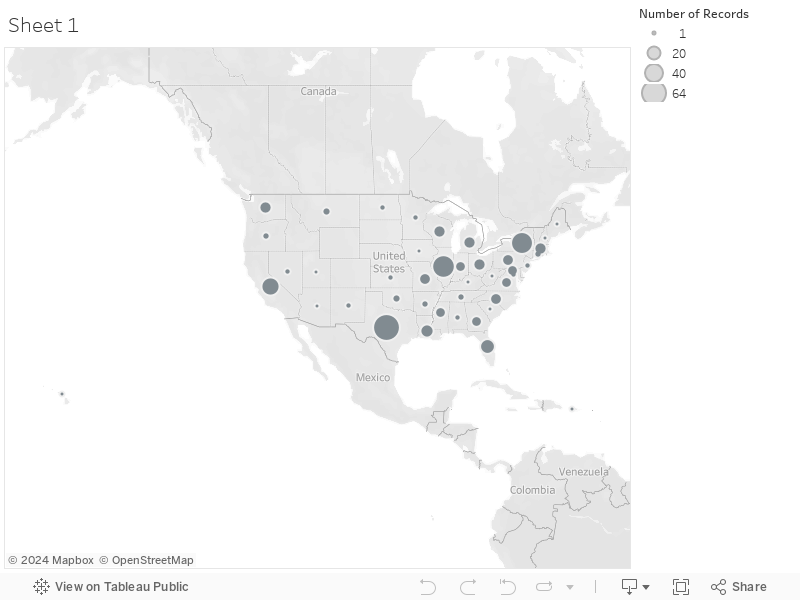
Map 2